
QGIS
Experienced

Hello, I'm
Data Science & GIS Engineer


Get To Know More

6+ years
Data science & GIS

BE Geo-Informatics
M.Eng. Geomatics
Geospatial data engineer with 6+ years of experience across space weather research, GNSS data processing, and large-scale geospatial analytics. At DLR, enhanced ionospheric monitoring systems through interactive visualization tools, scalable PostGIS databases, and OGC-compliant web services. Previously at Trimble, led geospatial automation projects that improved routing efficiency and data accuracy for nationwide logistics operations. Skilled in Python, PostGIS, GeoServer, and QGIS, with a strong focus on performance-driven ETL pipelines, spatial data infrastructure, and visualization for scientific and operational applications.
Explore My
Experienced
Intermediate
Intermediate
Intermediate
Basic
Intermediate
Intermediate
Intermediate
Basic
Intermediate
Intermediate
Intermediate
Browse My Recent
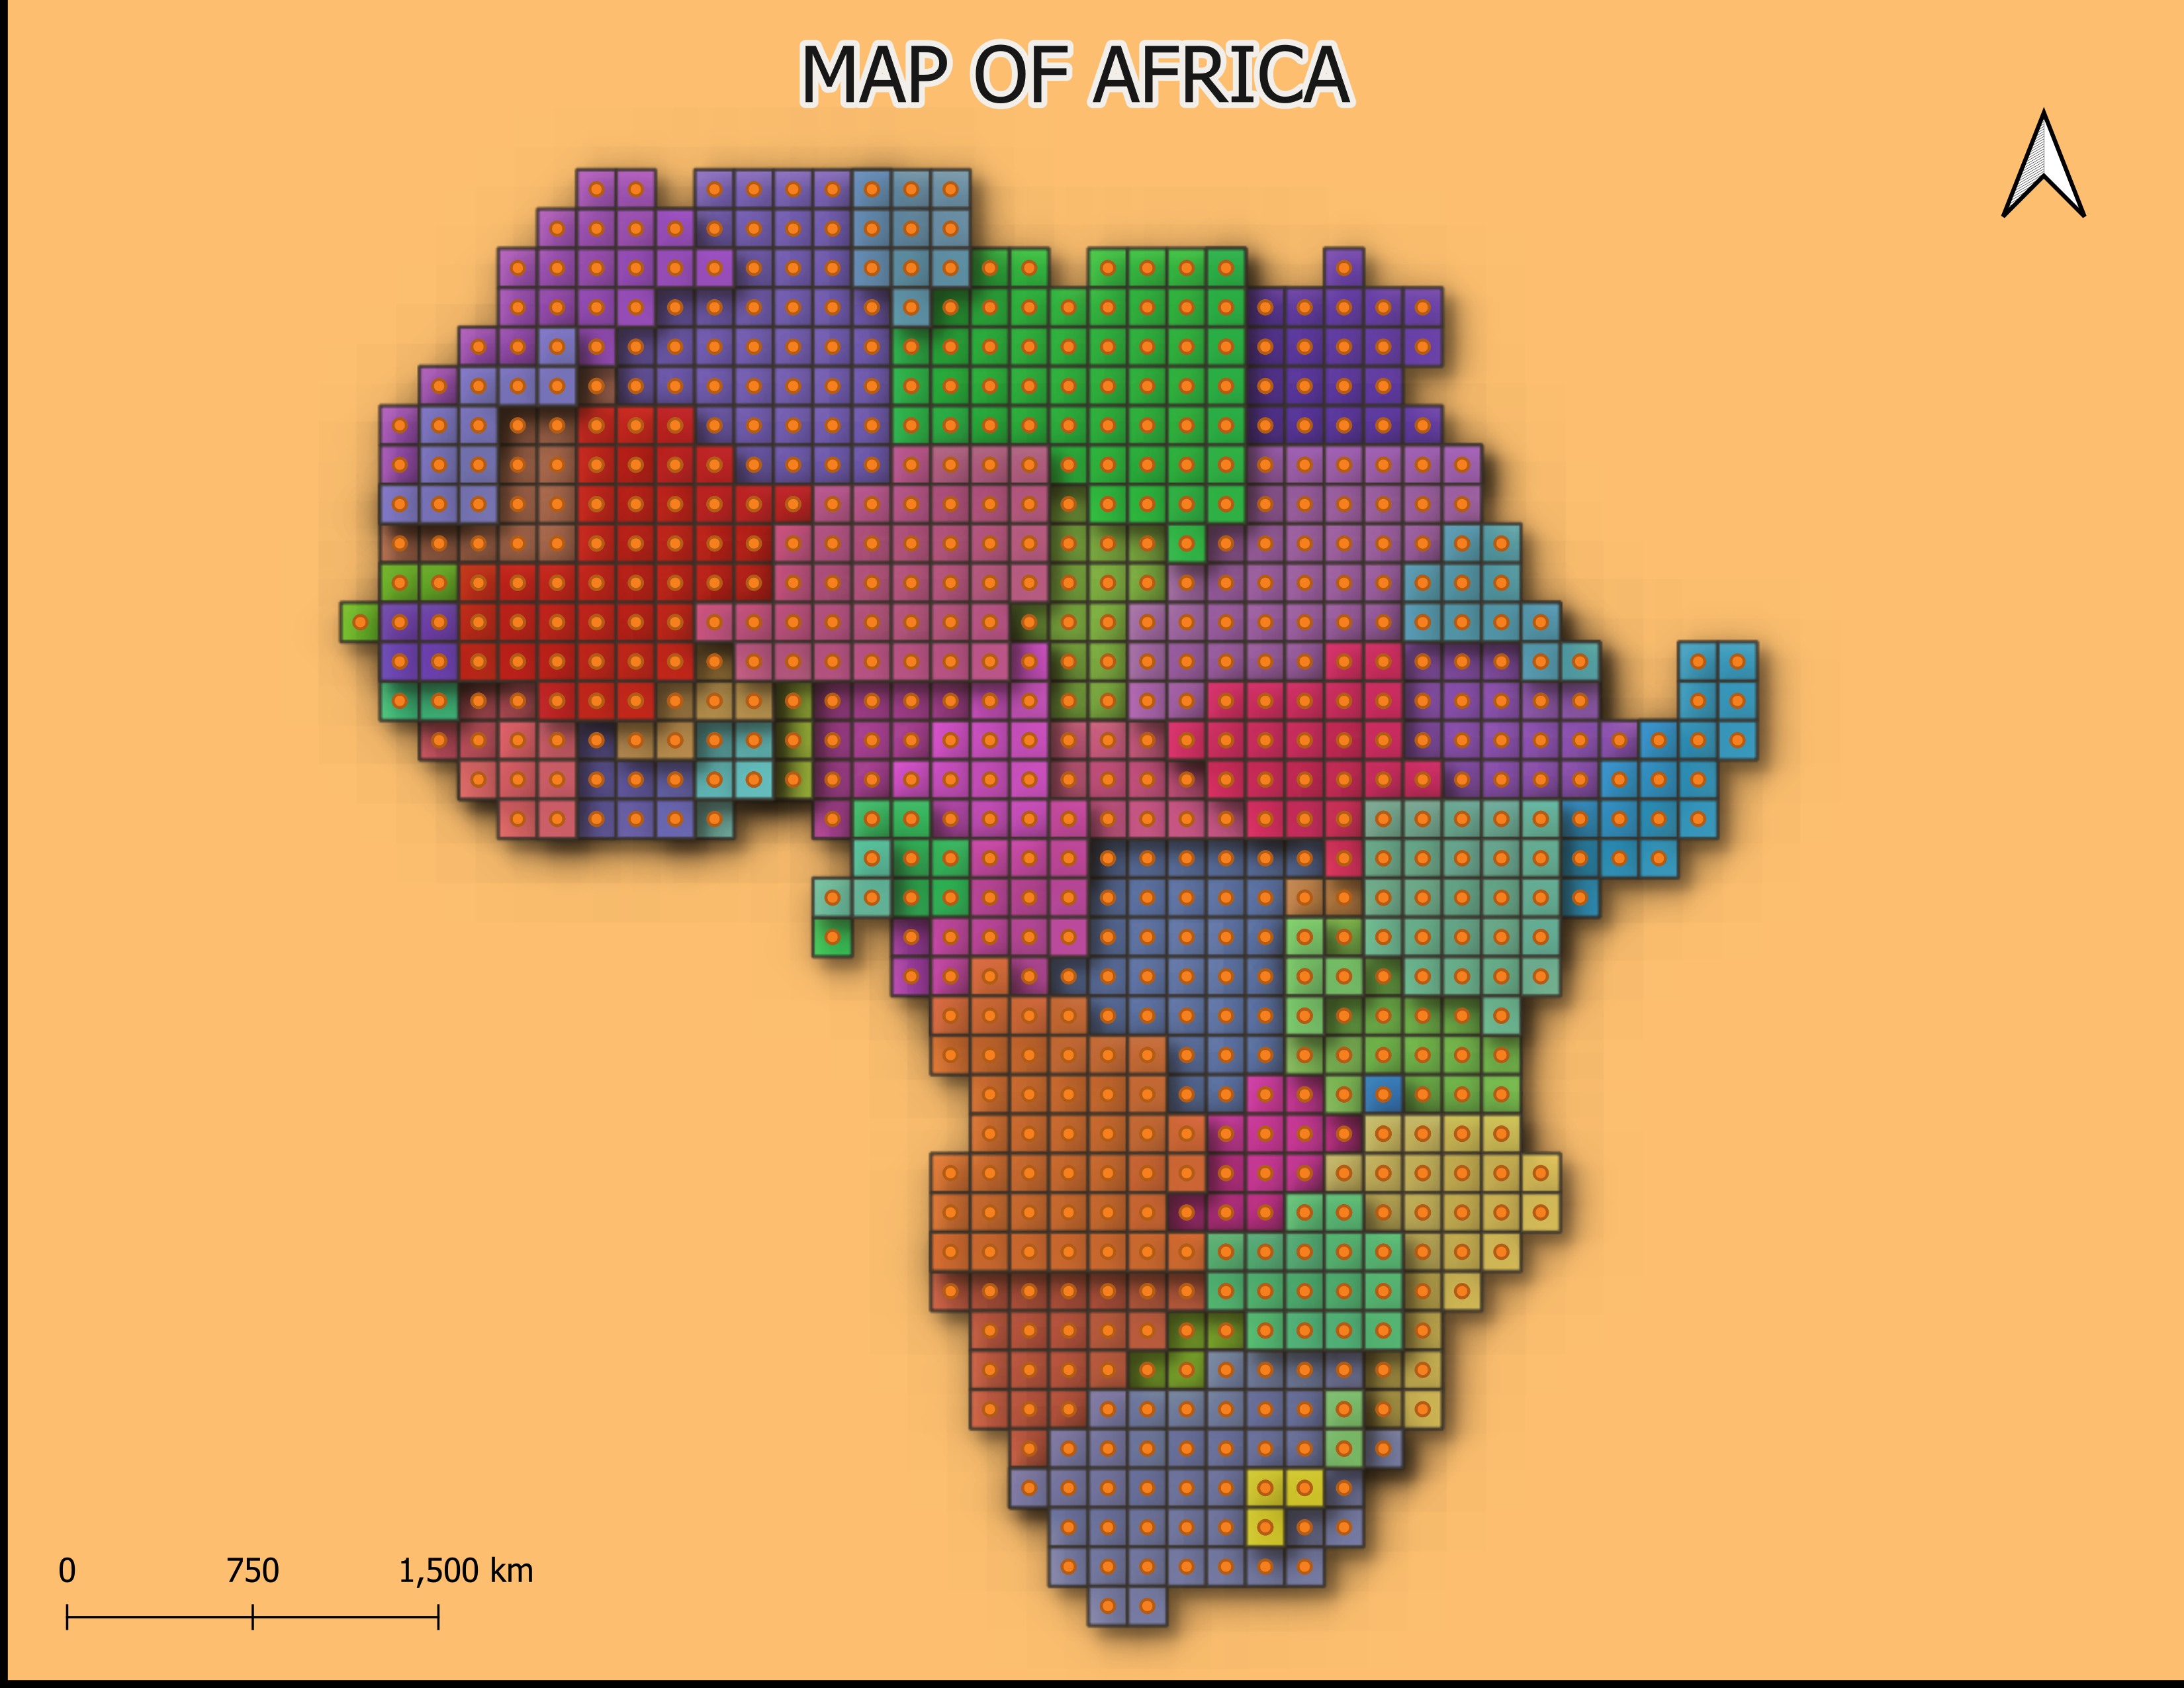
LEGO-style map of Africa created in QGIS, transforming geographic data into a colorful block-based visualization.
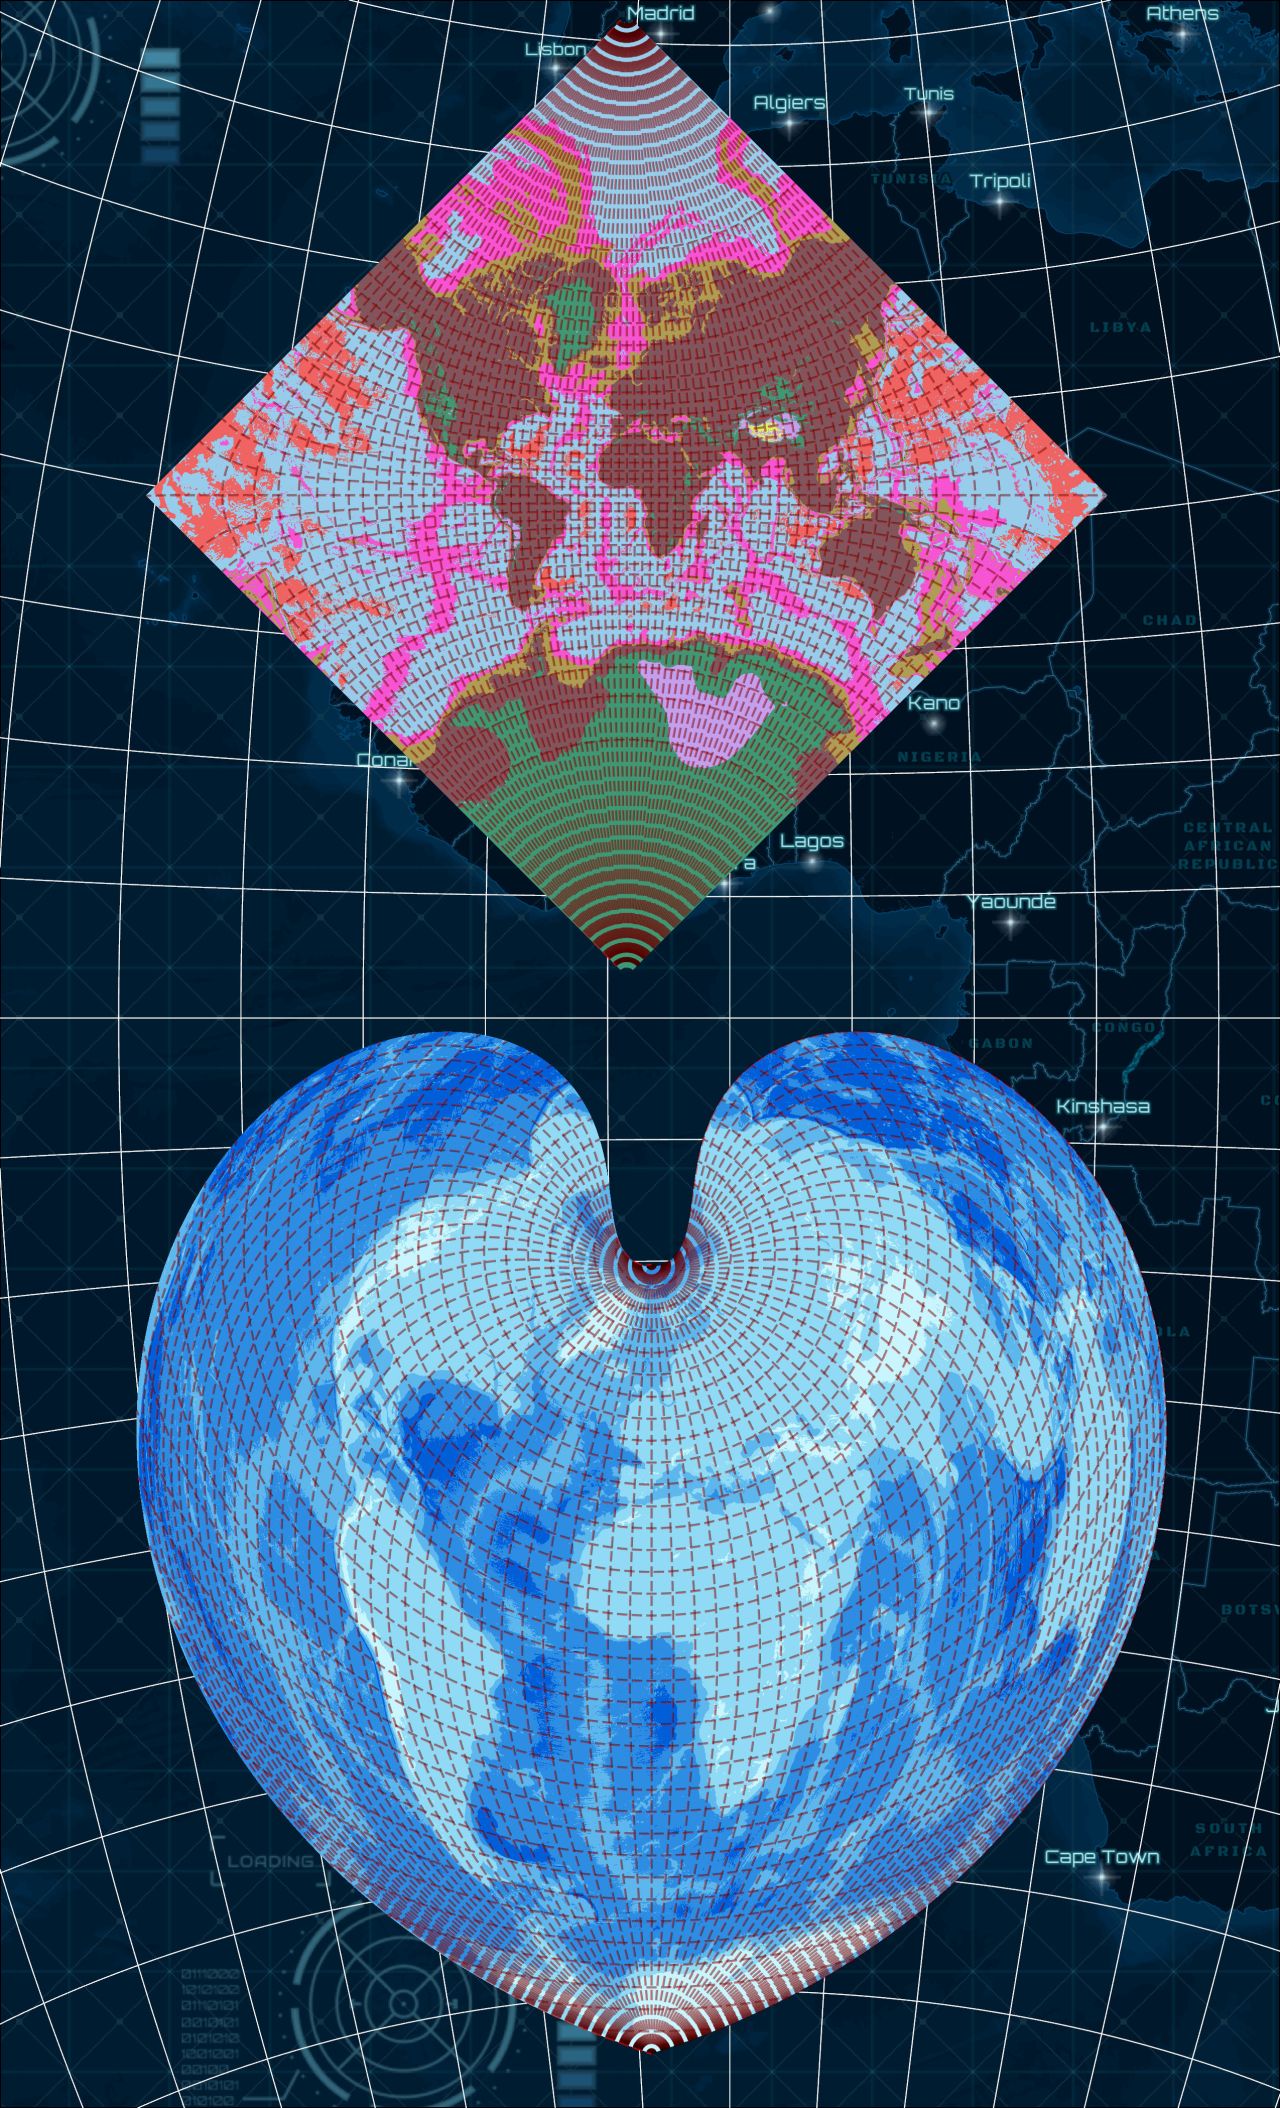
Created three unique projections Adams, Bonne, and Cassini in ArcGIS Pro to showcase cartographic diversity.
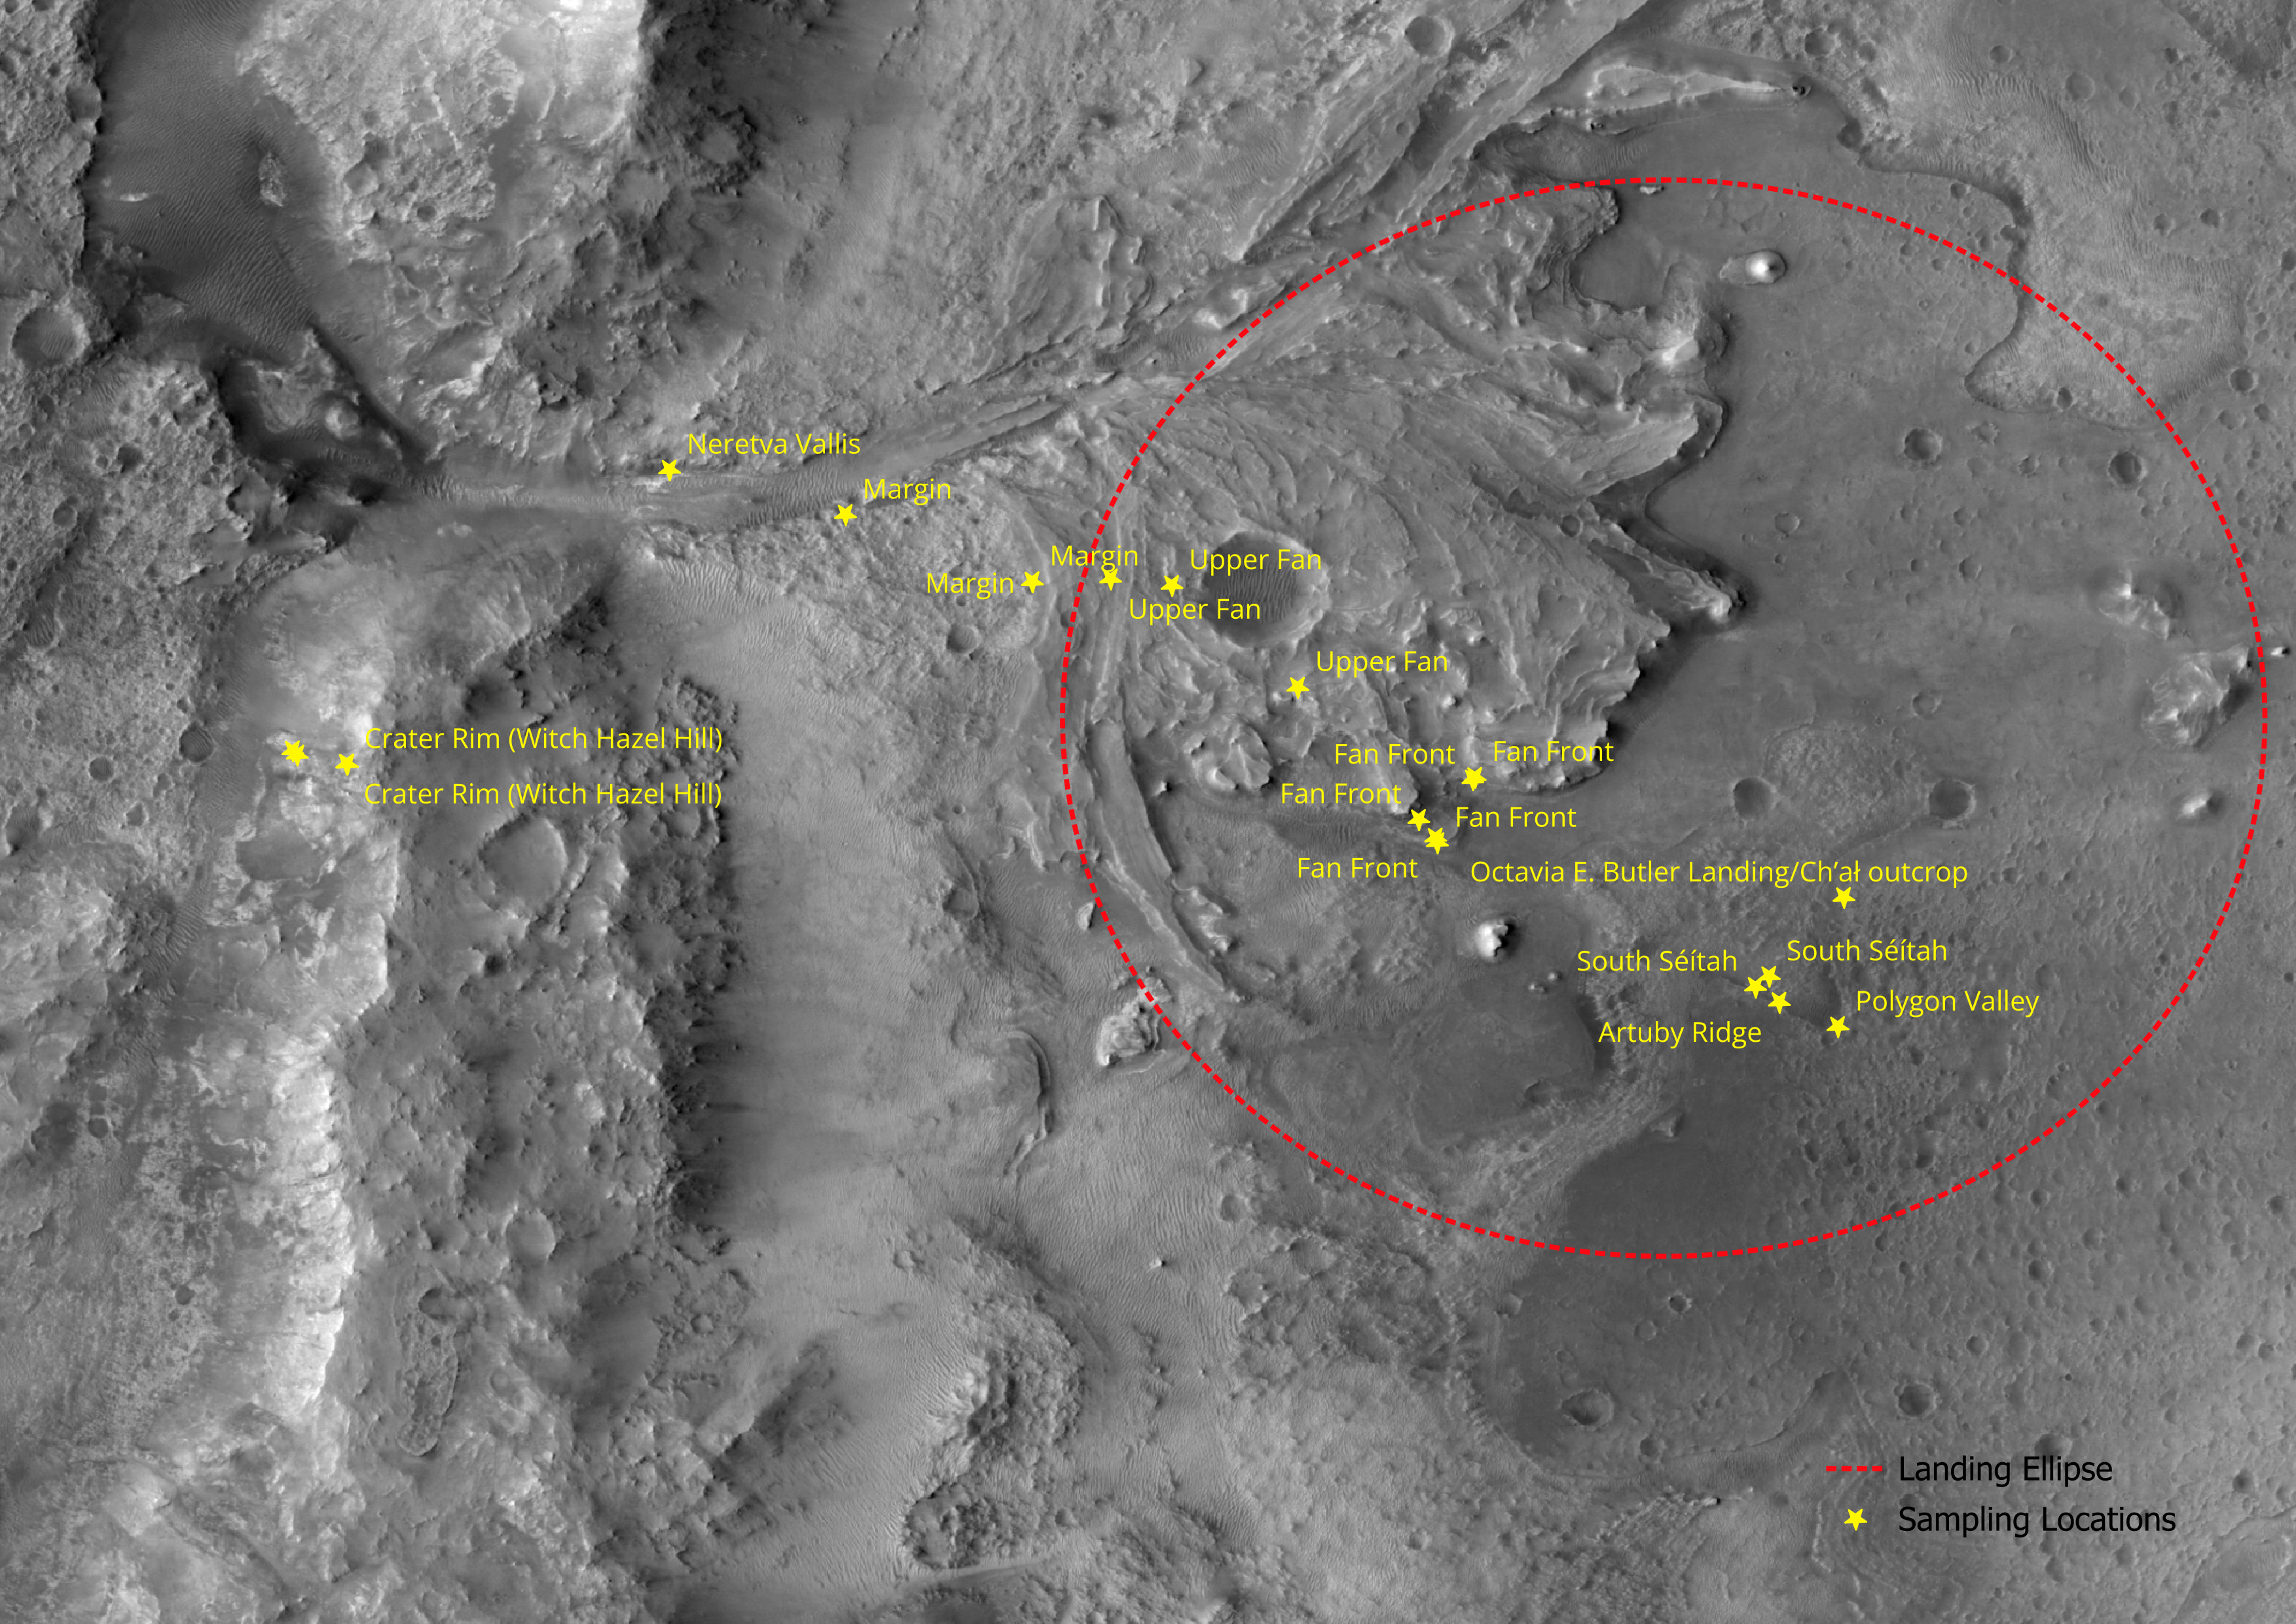
Plotted key points from NASA’s Perseverance mission landing ellipse and sampling sites revealing Jezero Crater’s story of exploration.
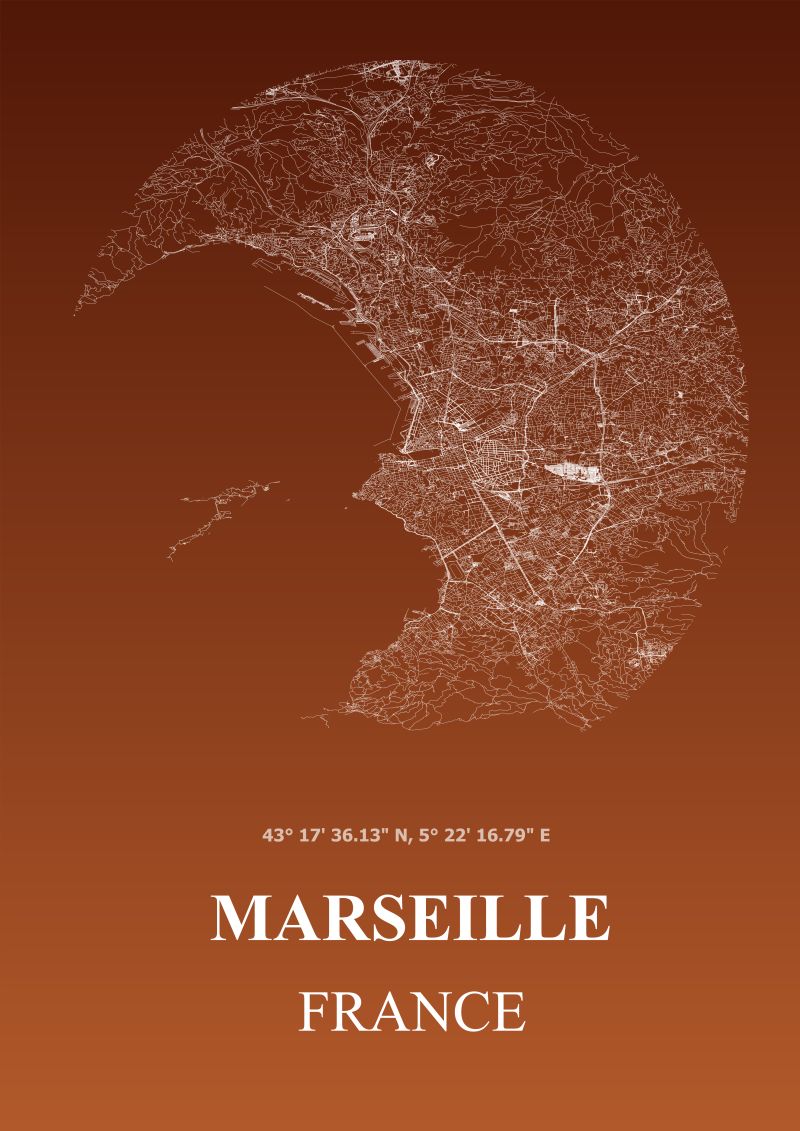
Created a minimalist two color map of Marseille’s highway network using OpenStreetMap data for a bold visual effect.
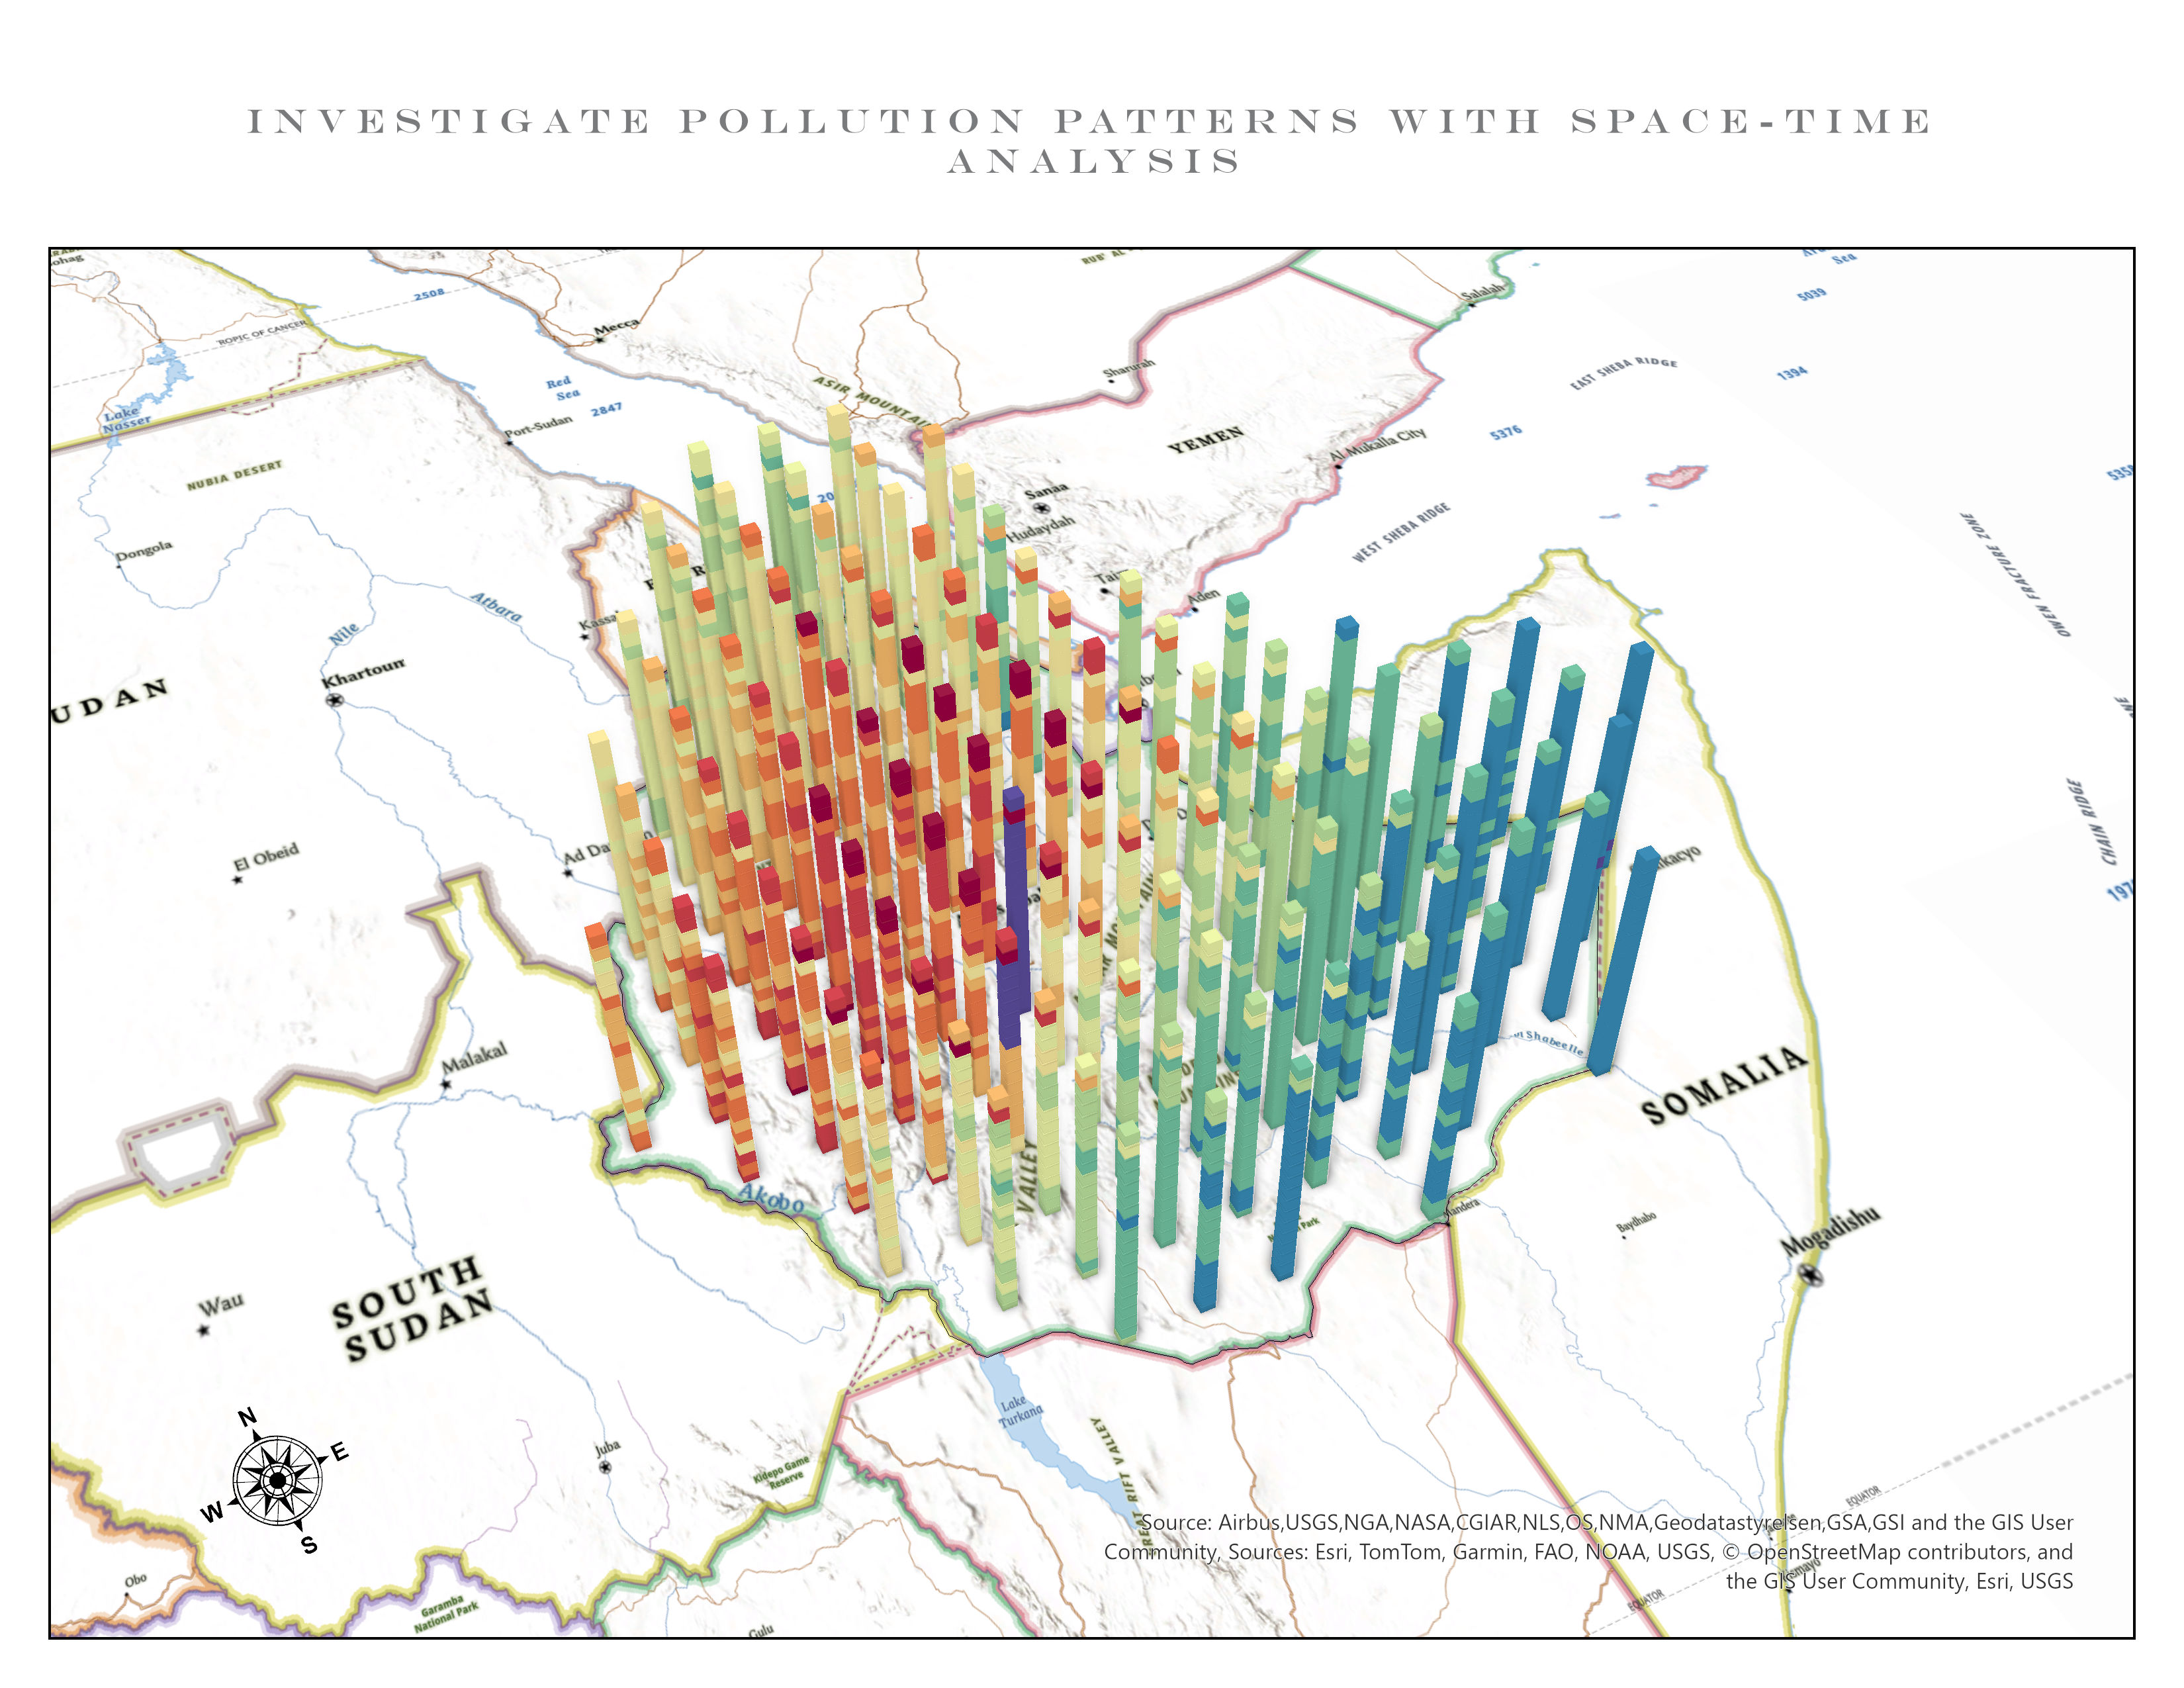
Visualized PM2.5 pollution trends across Ethiopia using ArcGIS Pro’s space-time cube, revealing evolving hot and cold spots in 2D and 3D.
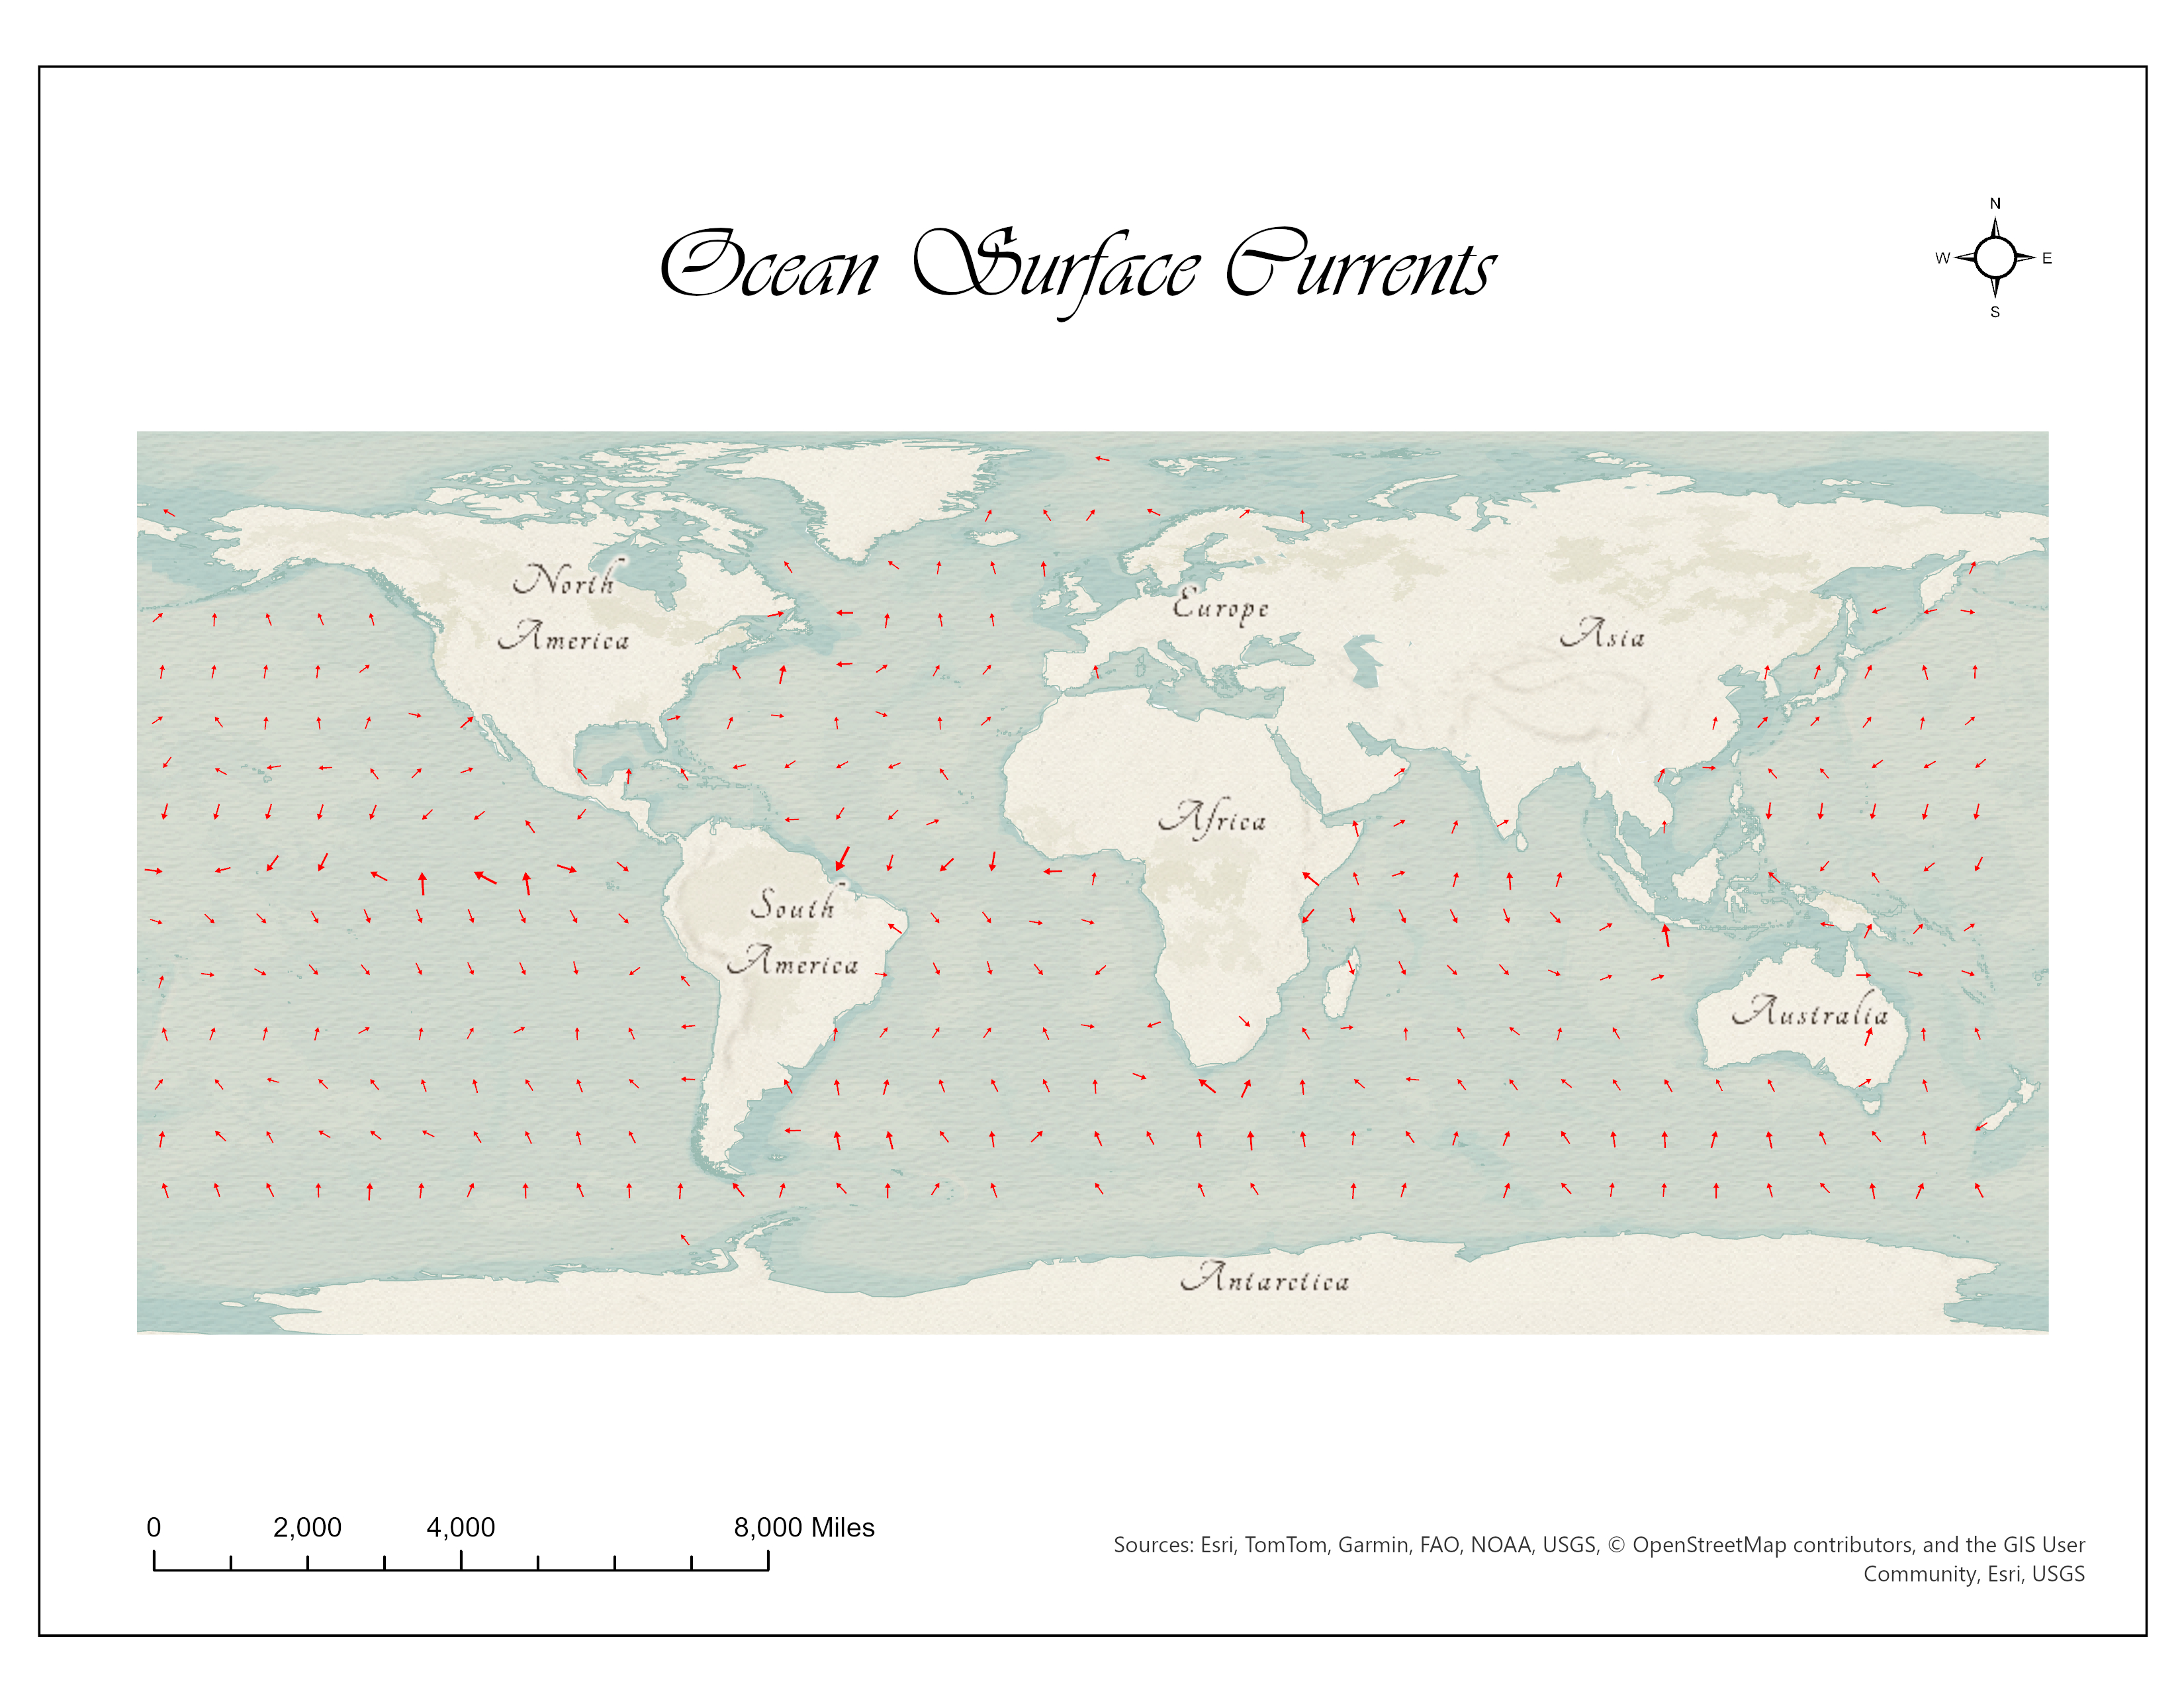
Mapped worldwide ocean surface currents using Esri’s climatology dataset, visualizing dynamic global flow patterns from satellite-tracked buoys.
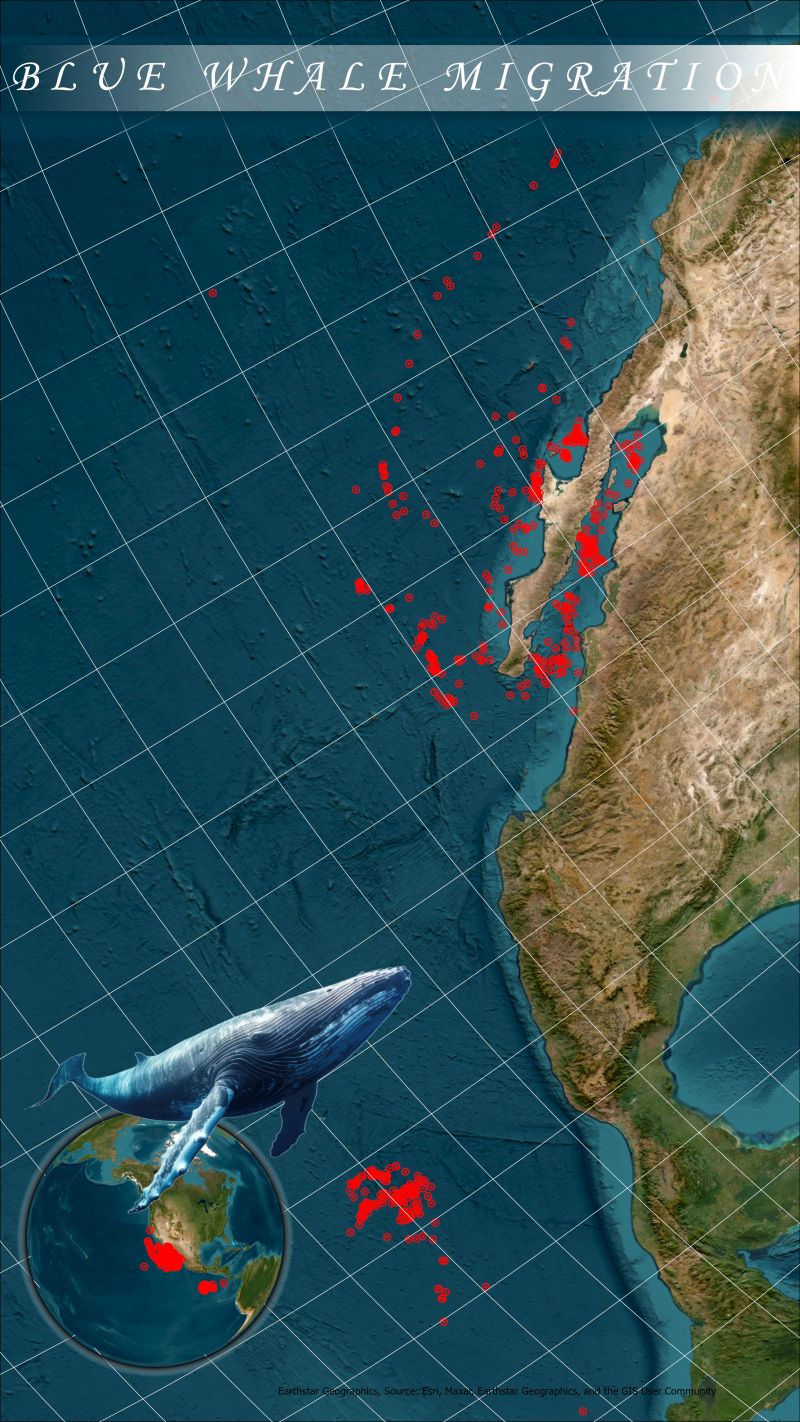
Visualized blue whale migrations for 2000, 2004, and 2008 in ArcGIS Pro, highlighting seasonal hotspots using Movebank data.
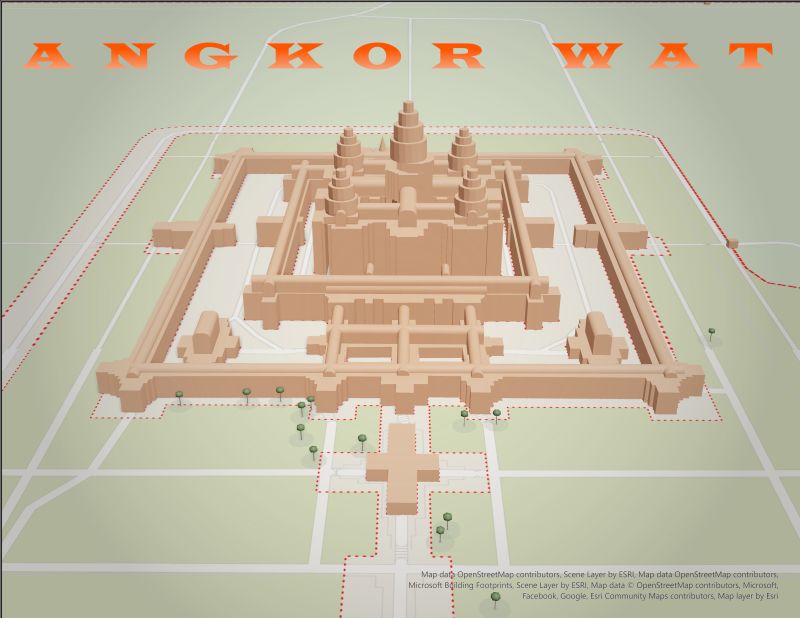
Created a detailed 3D map of Angkor Wat, Cambodia, using OSM 3D Buildings in ArcGIS Pro to showcase its architectural beauty.

Resampled Copernicus 30 m DEM to 10 m resolution for finer terrain visualization and detailed topographic analysis.
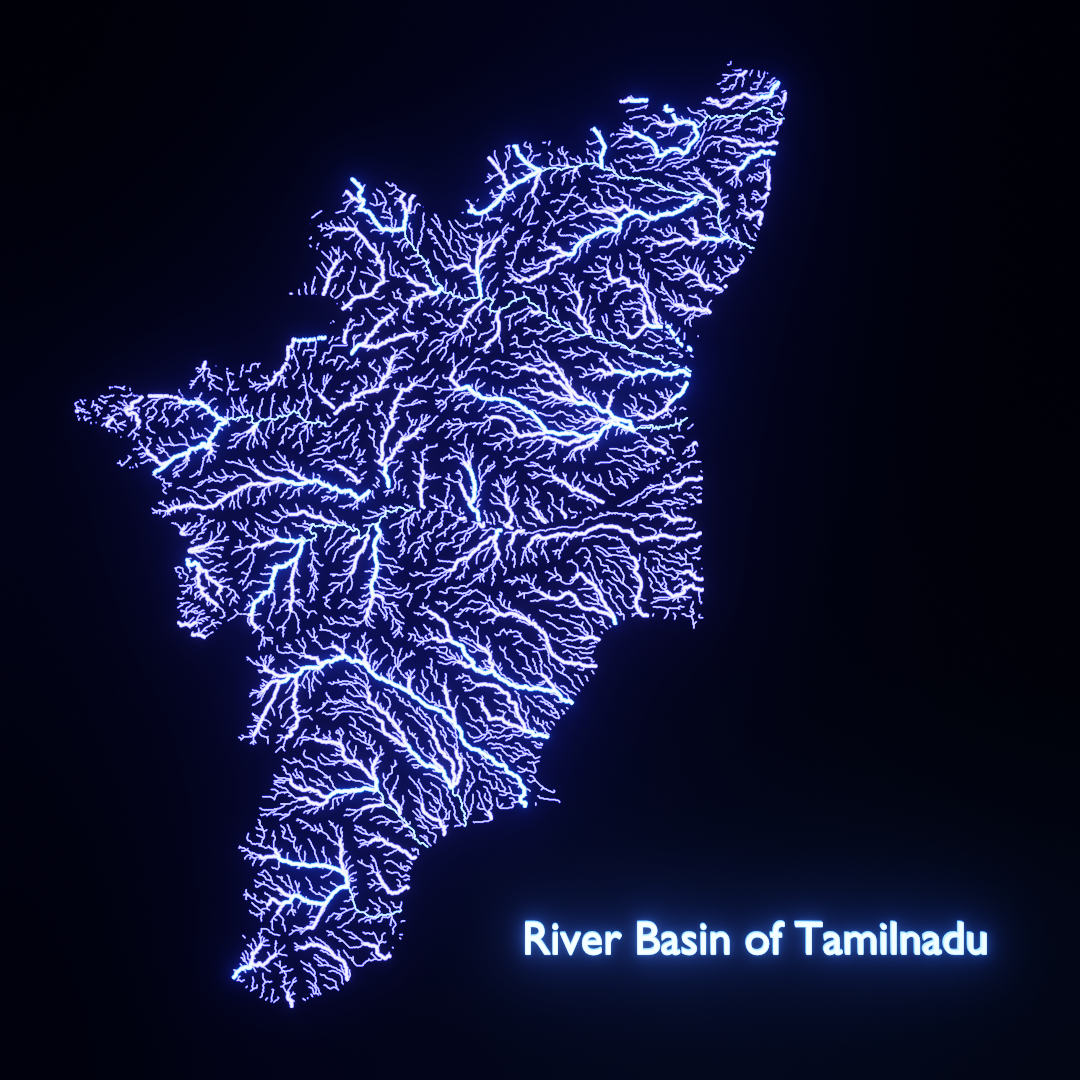
Created a precise 2D map of Tamil Nadu’s river basins in Blender, highlighting the region’s hydrological network.
Get in Touch